# How do I adjust the Goal Chart colors?
> Source: https://support.associationsphere.com/how-do-i-adjust-the-goal-chart-colors | Updated: 2024-08-25T18:15:53Z
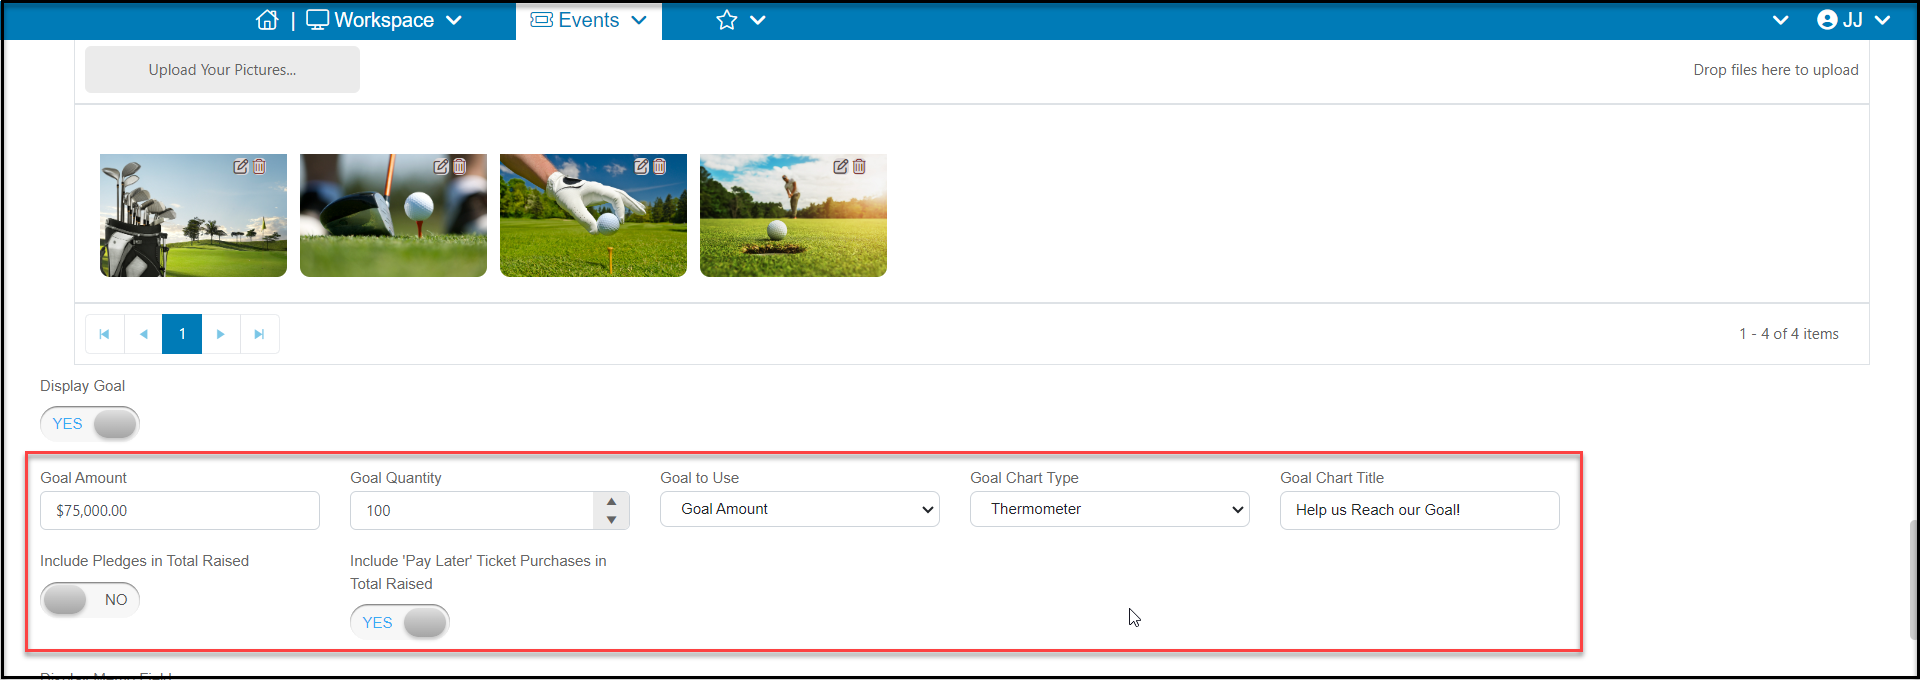
If you have activated a goal chart in the **Workspace > Events > Event Pages**, Event Settings tab, Page Content & Display Options section, you can make some minor adjustments to the colors on the display.
 To edit the colors, go to the Style Event Page tab, the following settings apply to the goal chart as follows:
Body
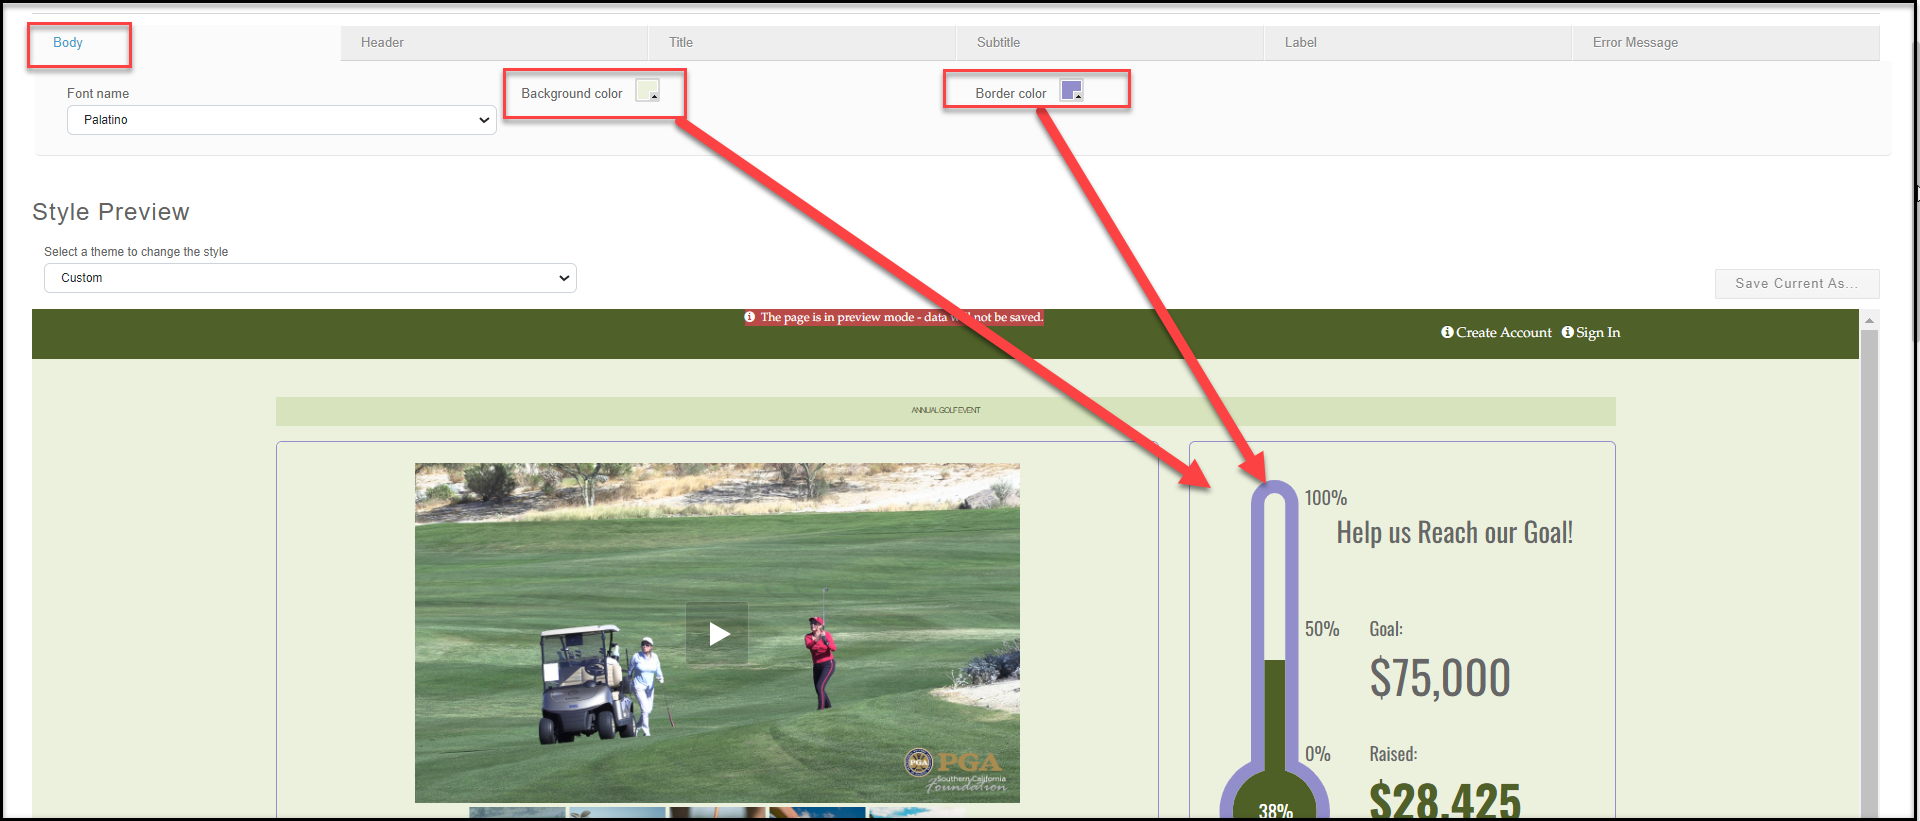
Background color - background color of the chart area
Border color - outline of the thermometer, or overall donut
Header
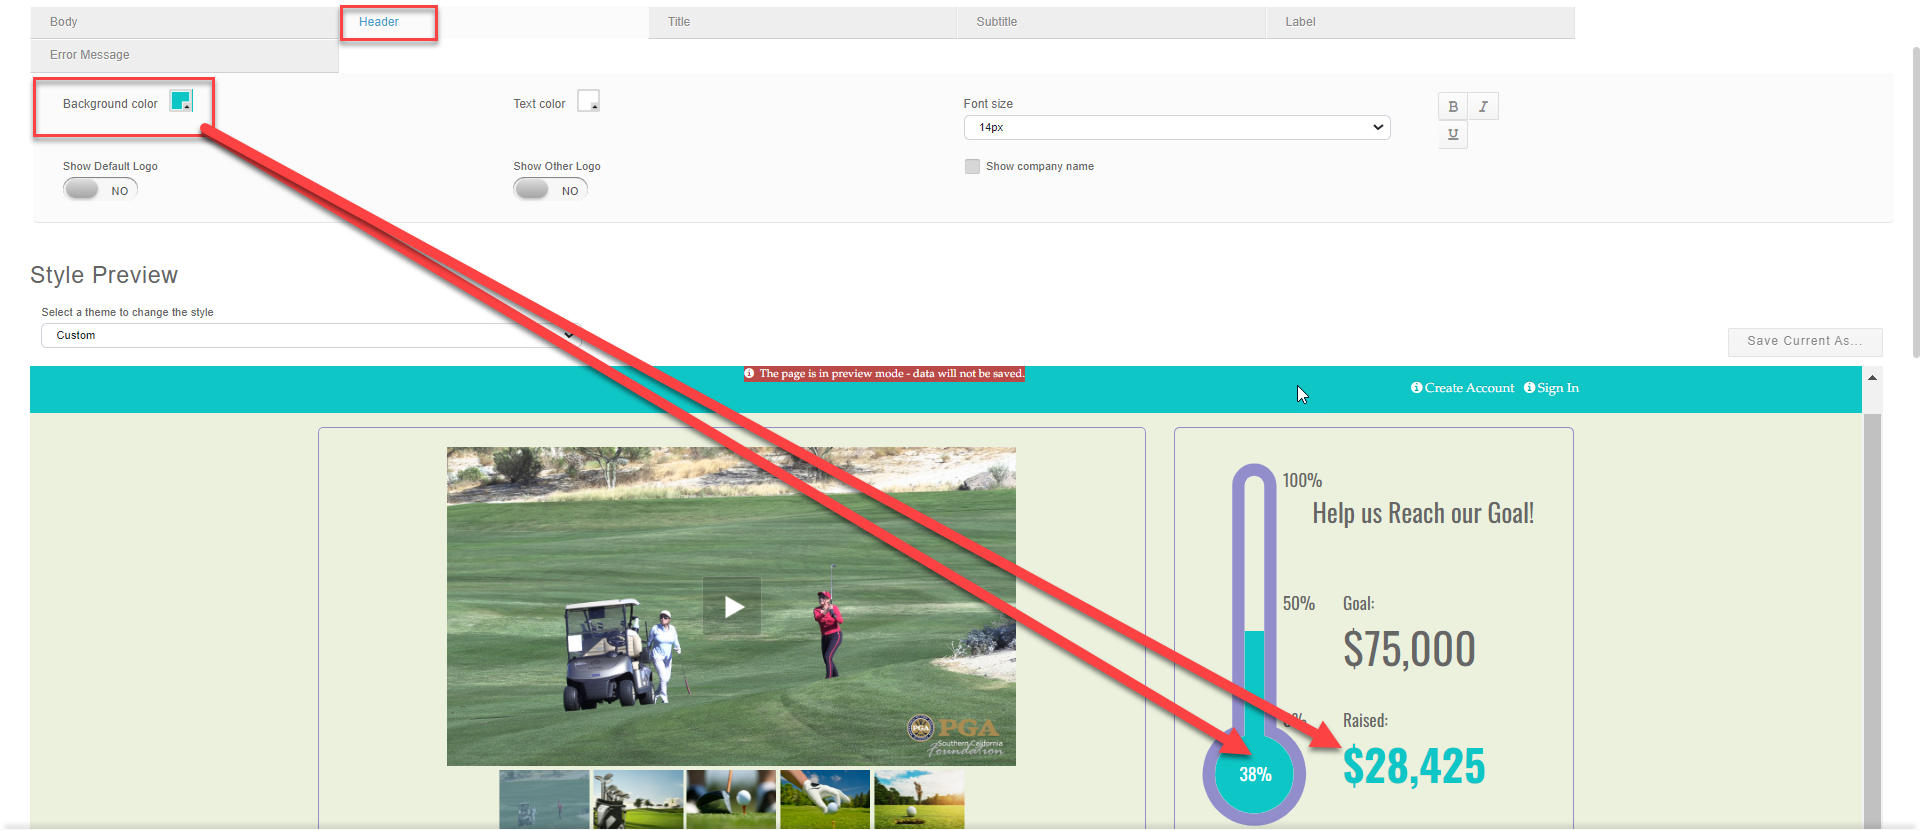
Background color - progress inside the thermometer or donut, and amount raised
Label
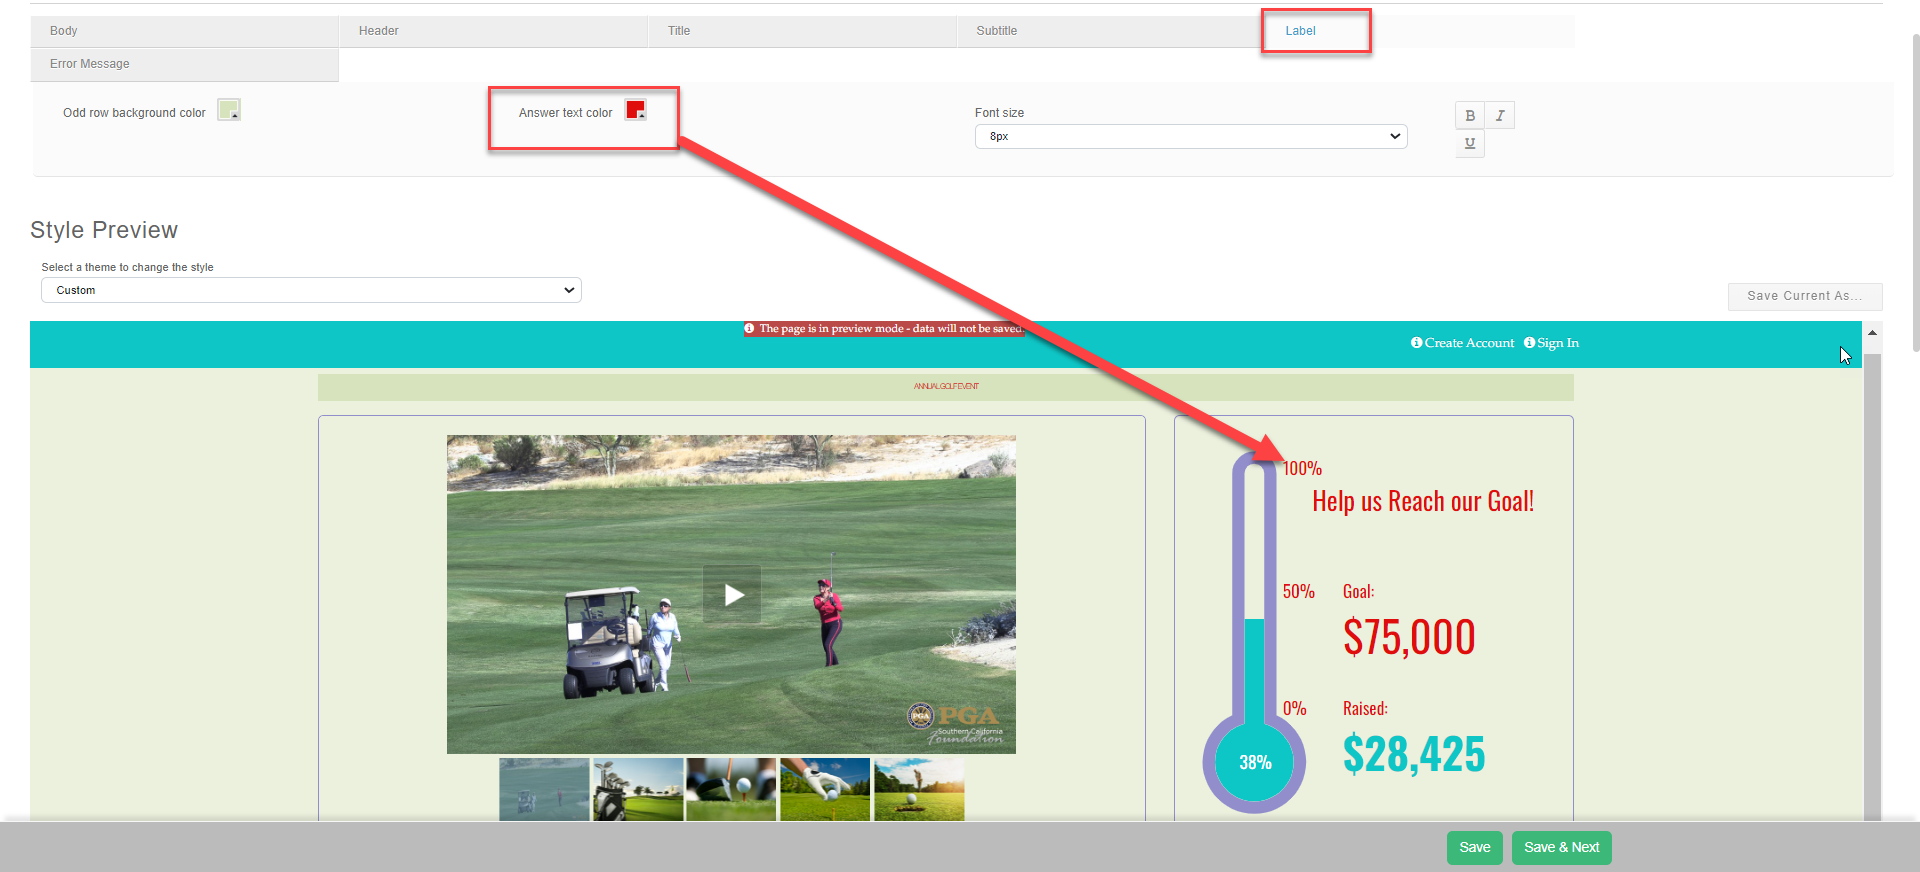
Answer Text color - Goal Chart Title and goal amount
**NOTE:** The Style Event Page must be saved in order to see the goal chart update(s).
***Examples***
**Thermometer**
To edit the colors, go to the Style Event Page tab, the following settings apply to the goal chart as follows:
Body
Background color - background color of the chart area
Border color - outline of the thermometer, or overall donut
Header
Background color - progress inside the thermometer or donut, and amount raised
Label
Answer Text color - Goal Chart Title and goal amount
**NOTE:** The Style Event Page must be saved in order to see the goal chart update(s).
***Examples***
**Thermometer**
 **Donut**
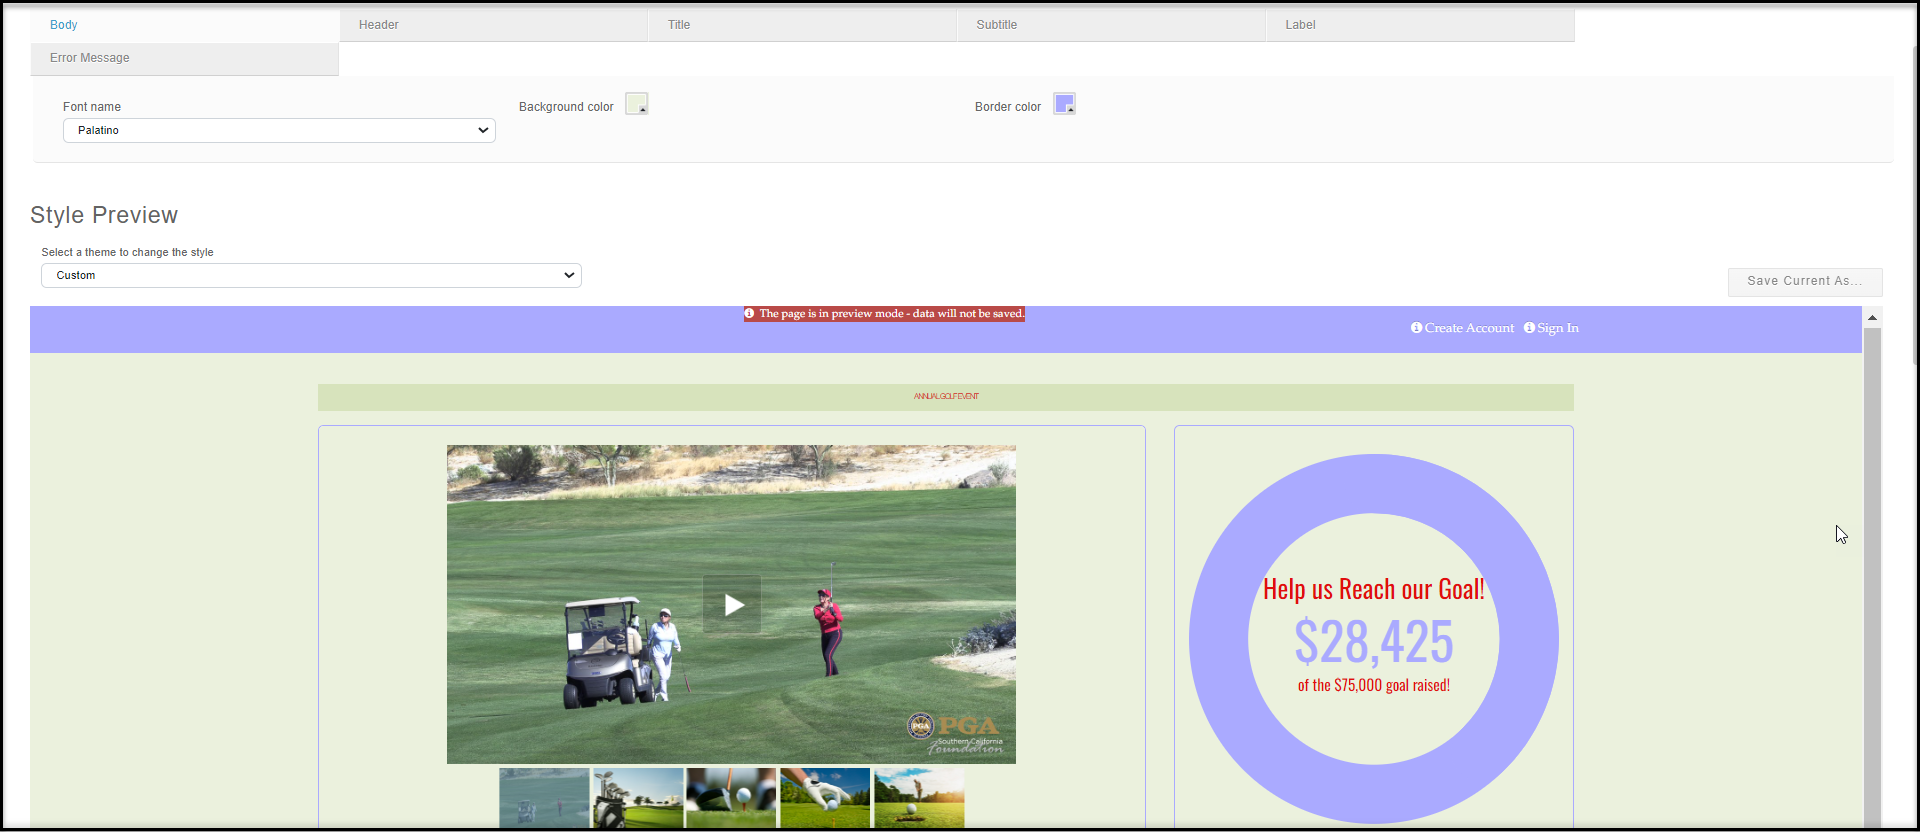
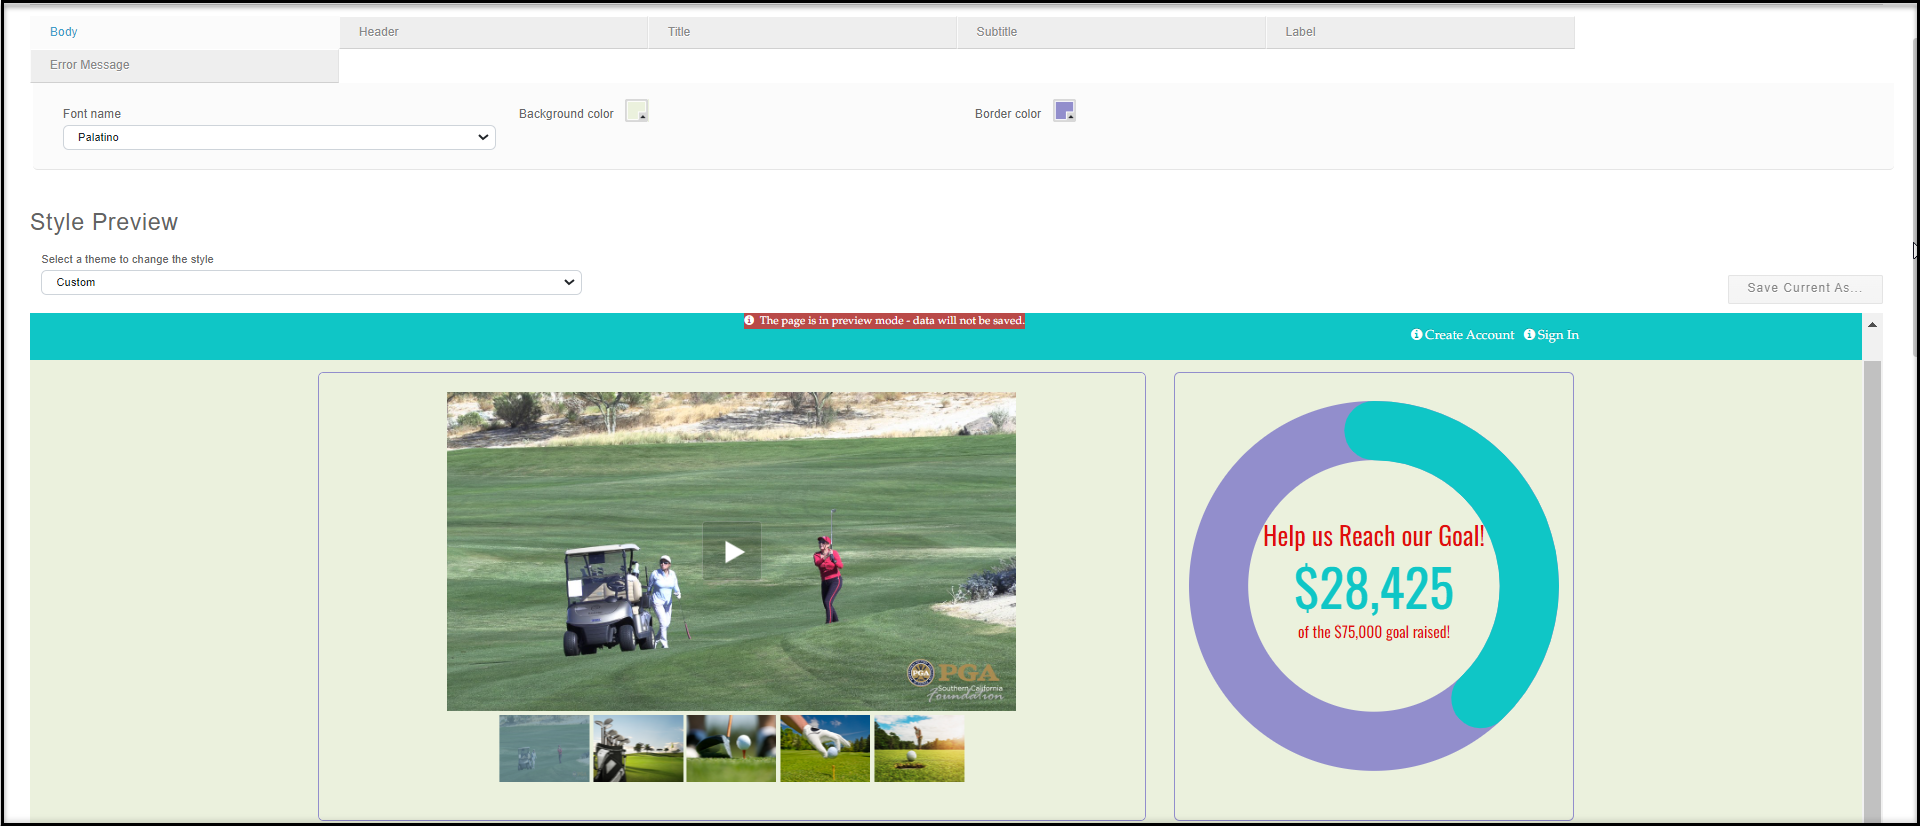 Note that on the donut view it is especially important that the progress (Header) and goal colors (body) are different so that you can see the progress. If the colors are the same, the donut will not show any progress.
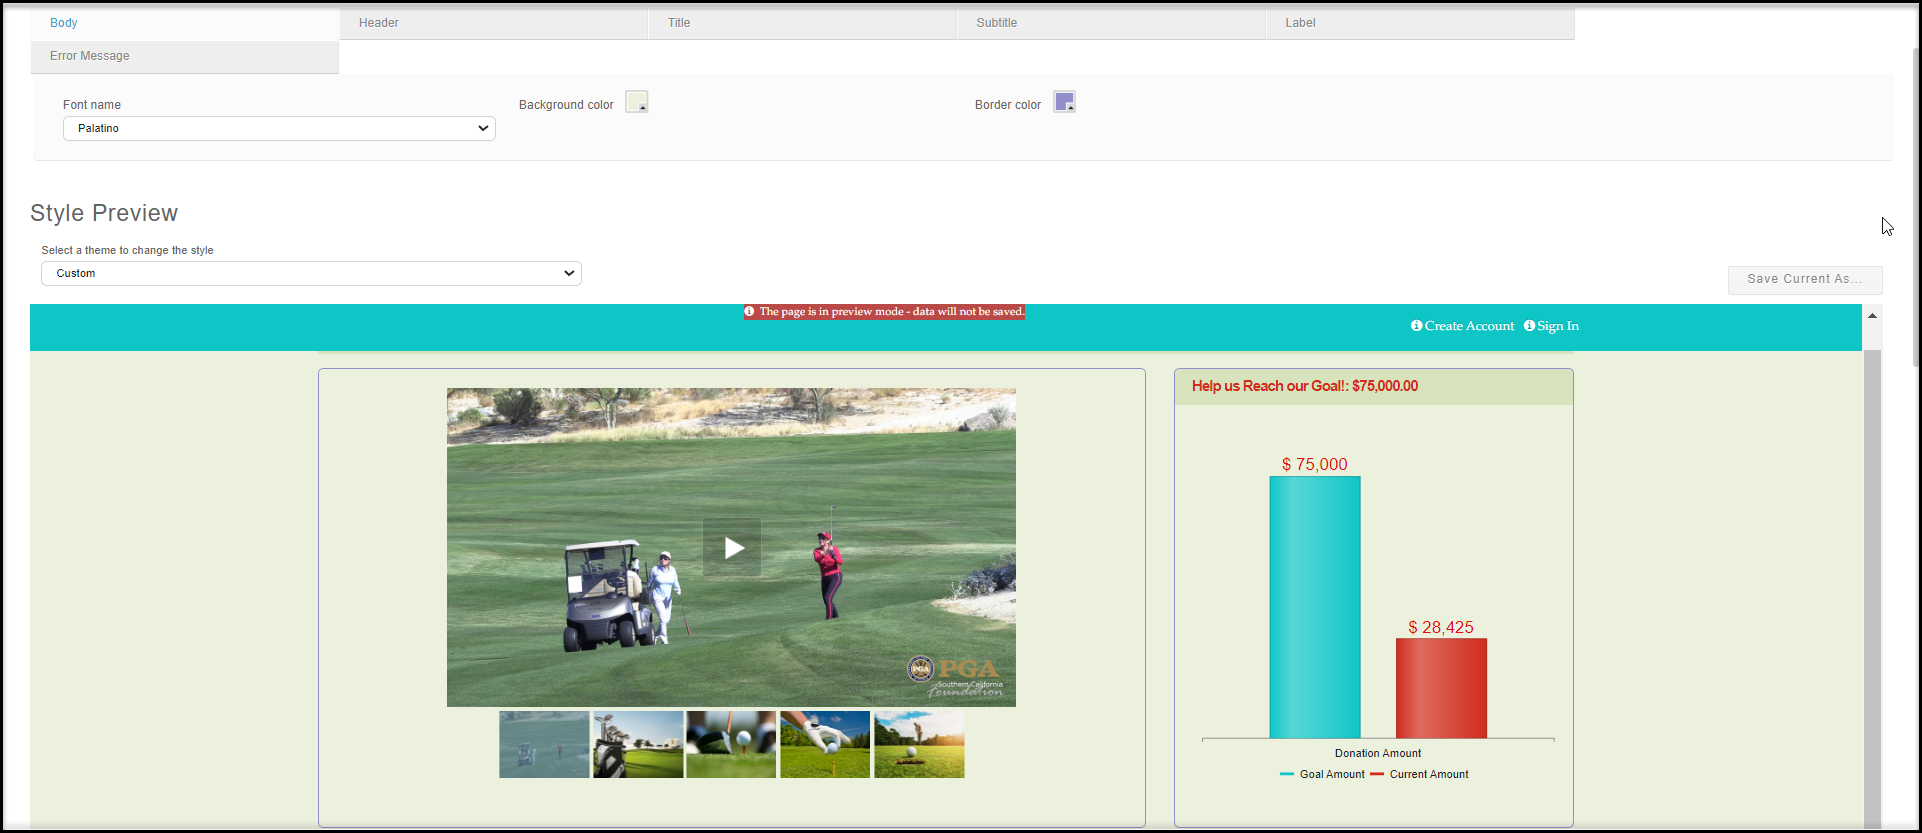
 **Bar Chart**