
Can I customize the graphics shown on the dashboards?
Updated Jul 18, 2024·1 min read
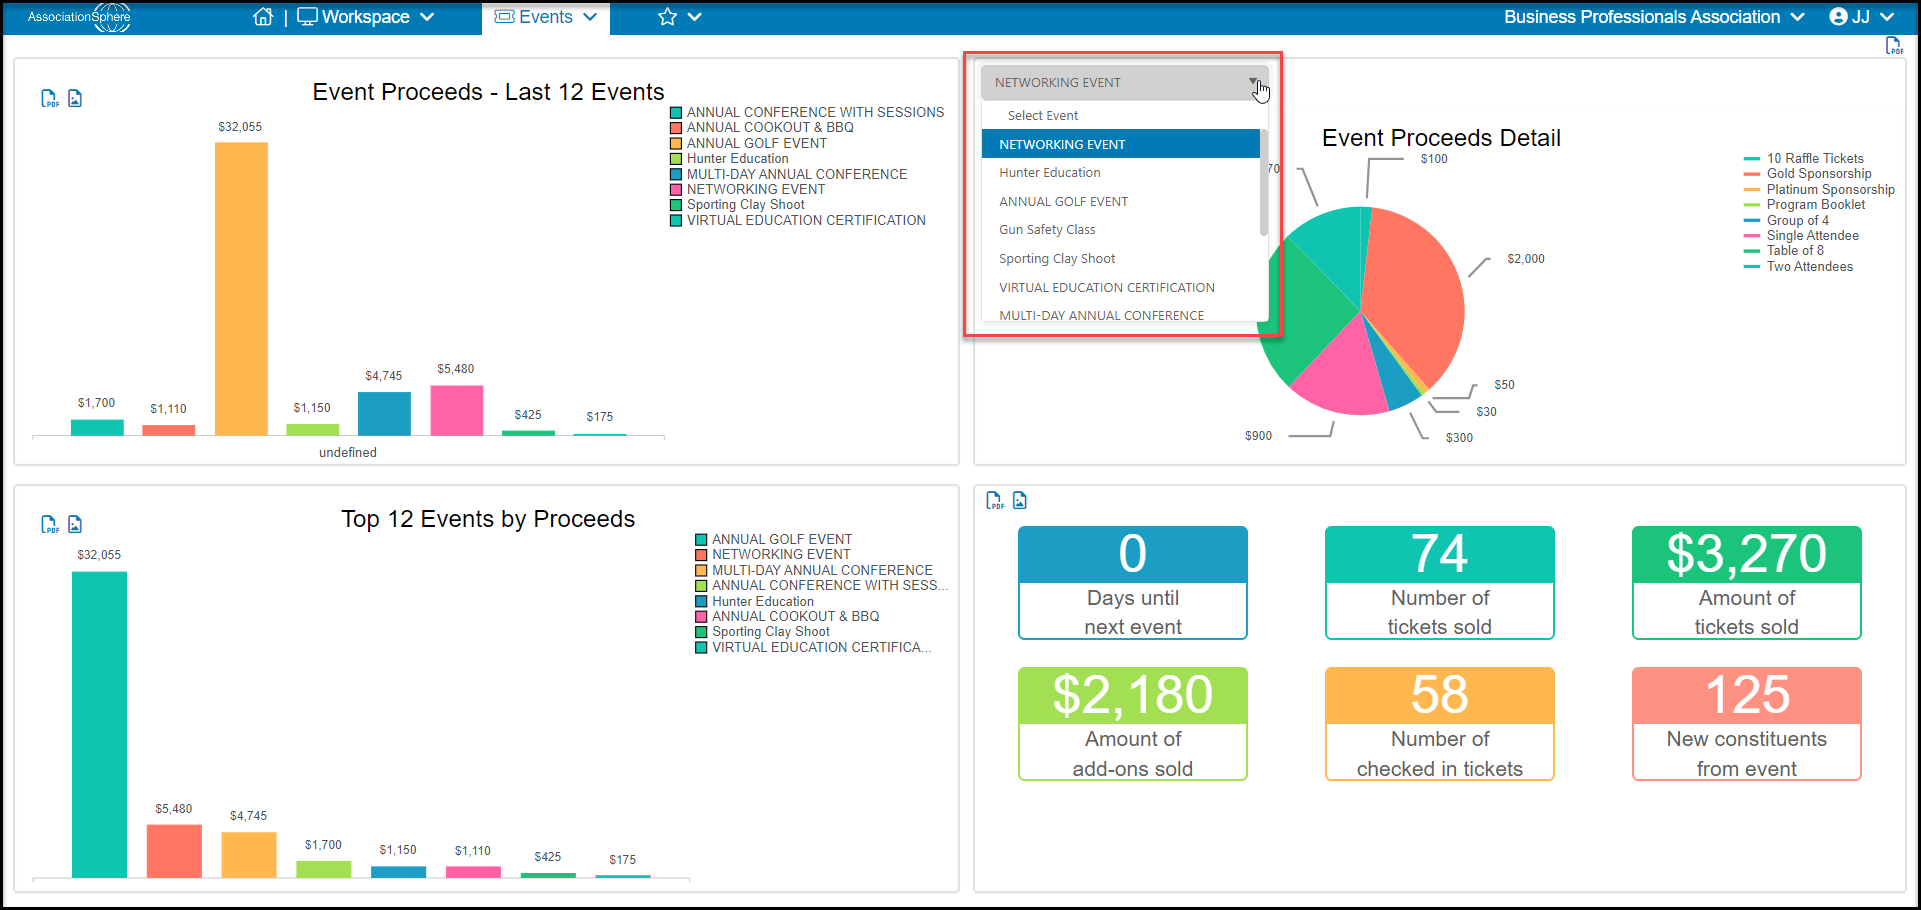
Currently, the graphics shown on the module dashboards are not editable. However some graphics have a menu option to show different data, for example the Events Module Dashboard, you can choose different data in the graphic on the top right corner.
Was this article helpful?