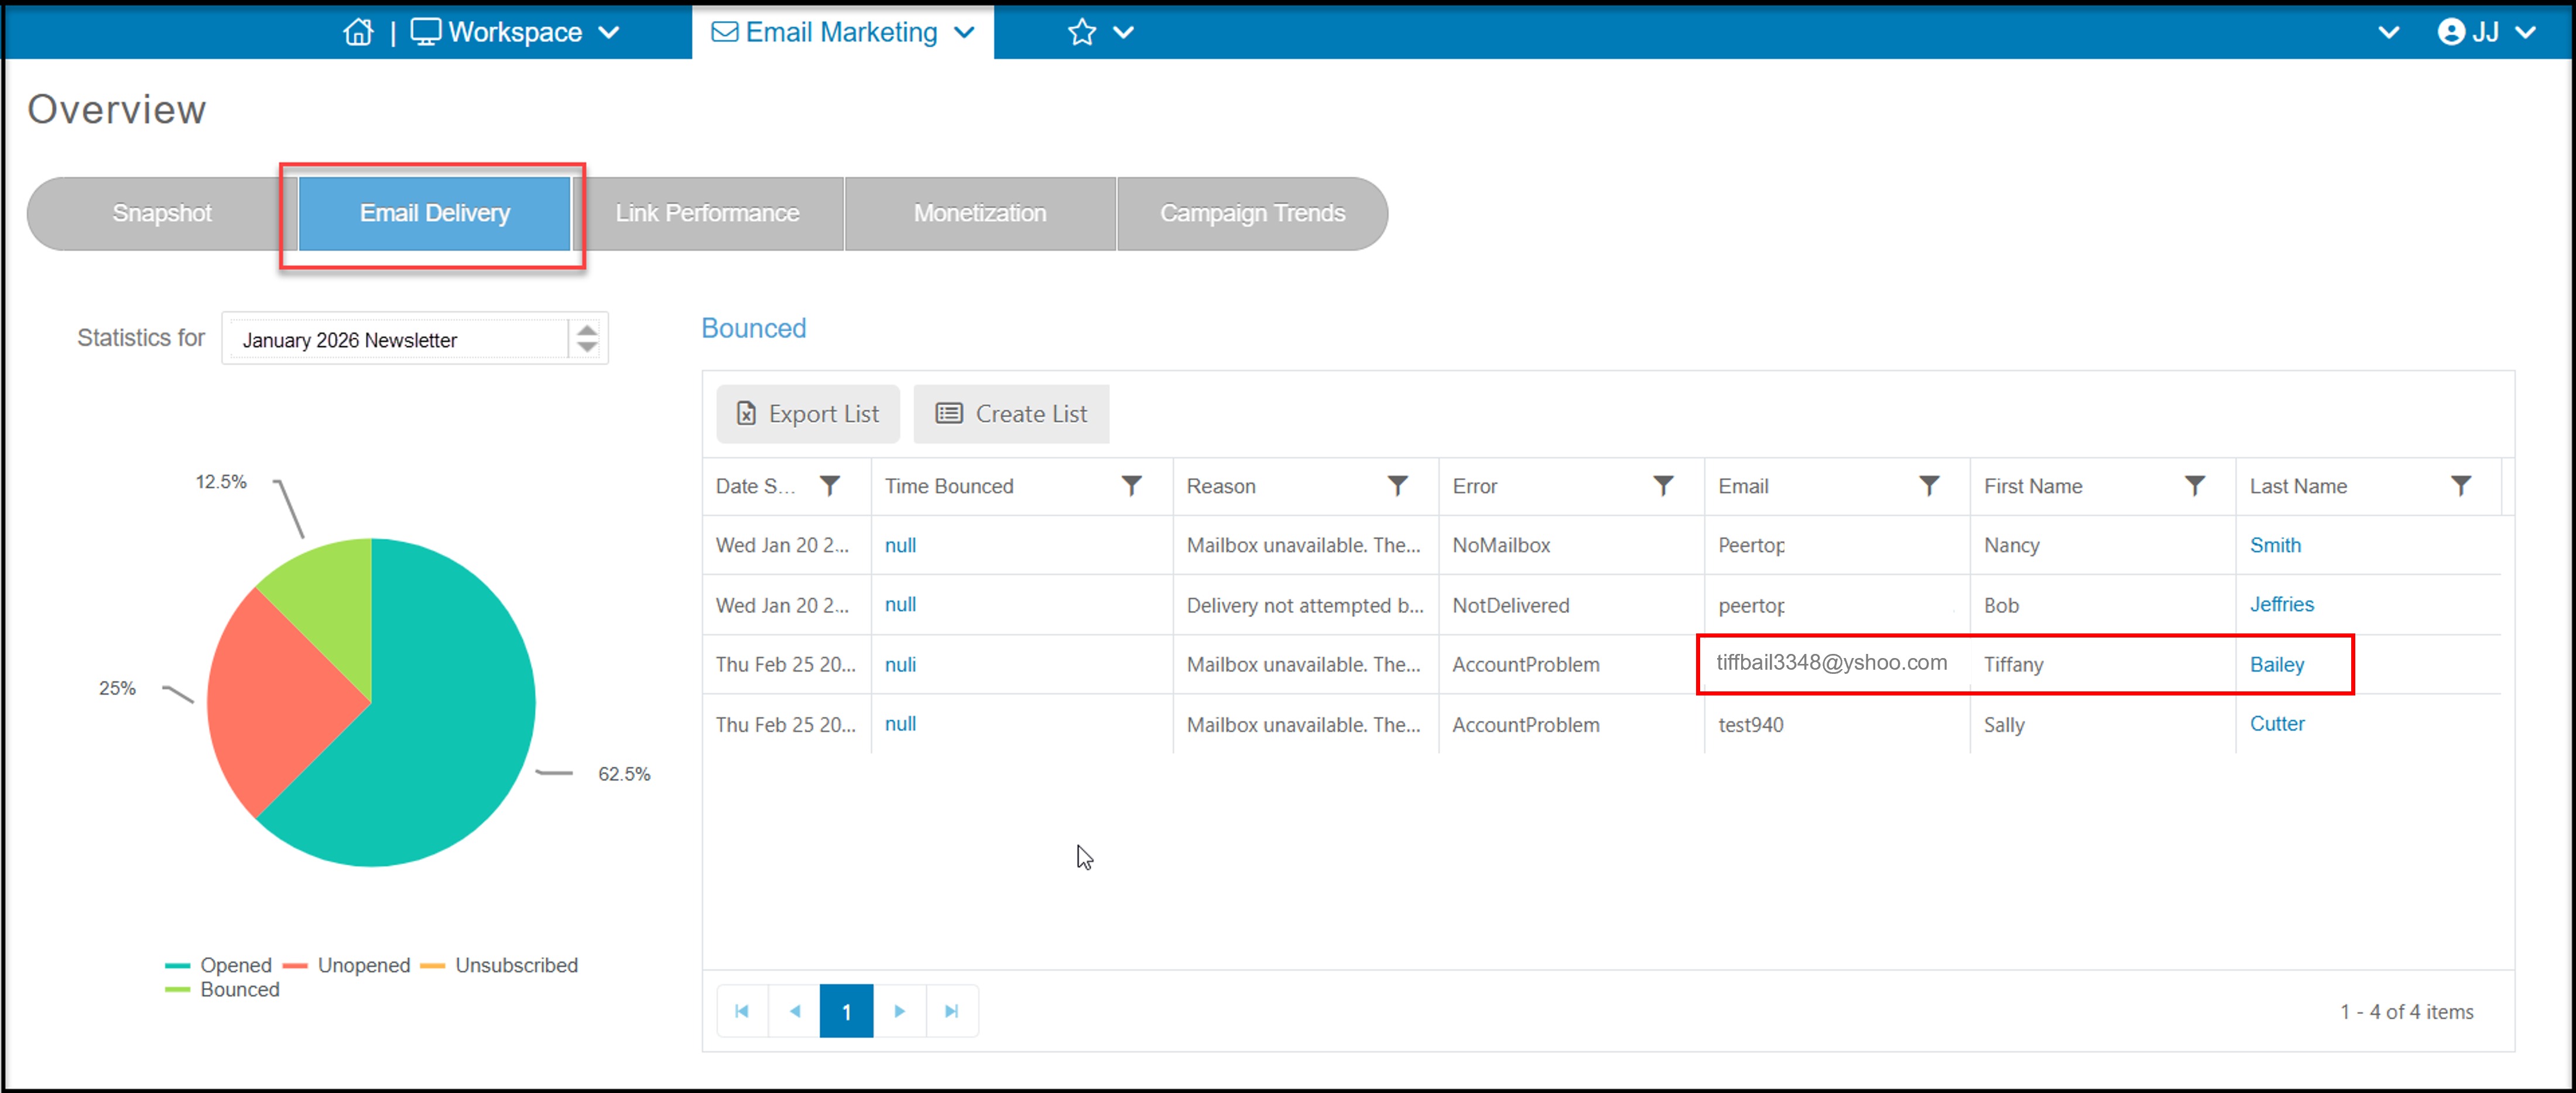
The email delivery tab is where you can view details for opened, unopened, bounced, and unsubscribed emails for a campaign.
You can view the percentage of opened, unopened, unsubscribed, and bounced emails on the pie chart that is to the left of the page. You can see the statistics for different campaigns by clicking the drop down menu that is located above the pie chart, and selecting the campaign you would like to see statistics for.
You can click on a piece of the pie chart to view which recipients fall into that category. For example, to see who opened the email, click on the Opened slice of pie. The grid on the right will populate with all recipients that opened the email. You can see the # of times they opened the email and when was the last time it was opened.
You can also create a new email list for the constituents shown on the list by clicking on Create List. You can also export the list to Excel by clicking on Export List.

If you have any bounced emails, you can click on that section of the pie to show the Reason and Error that occurred resulting in the bounce. If there is an obvious spelling error, such as Tiffany Bailey, below with yahoo incorrectly spelled "yshoo"," you can click on the constituent's Last Name to open their record and make a correction and clear the hard bounce status.