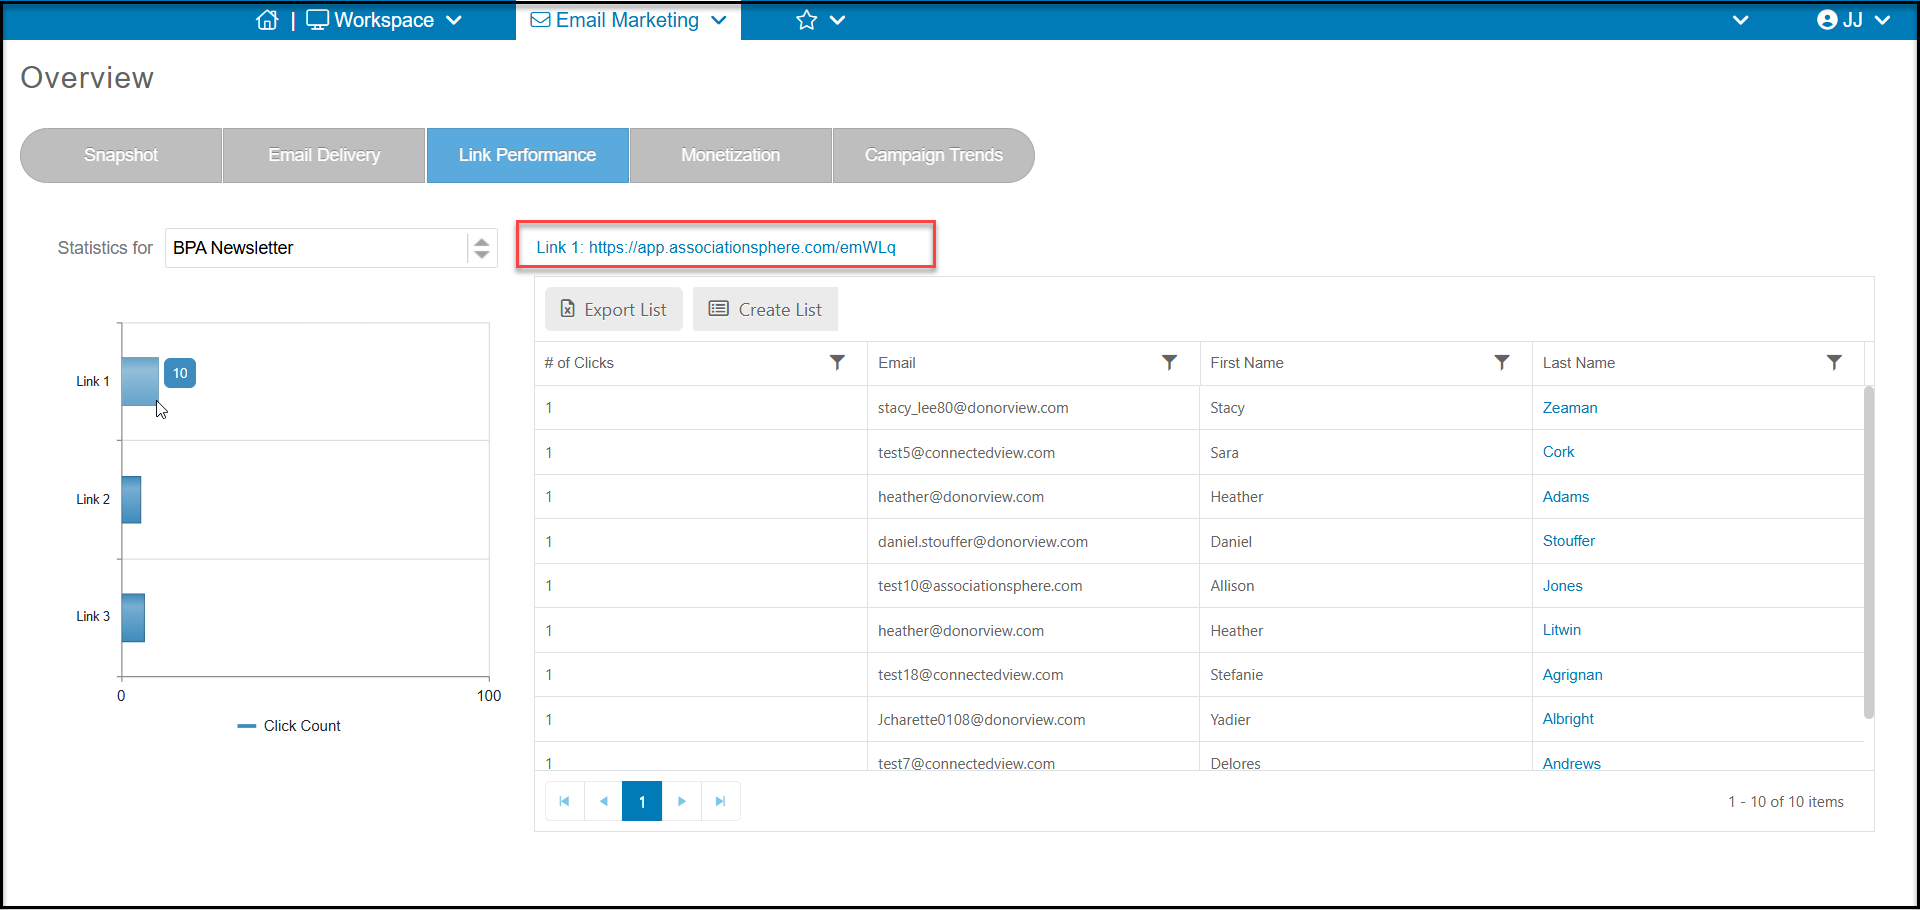
In the Link Performance tab, each bar on the bar graph represents a link that was included in your email campaign. Each bar is labeled “Link 1, Link2, Link3, etc.” Once you have clicked on a bar the statistics for your link details will show up on the grid. Just above the grid, you will see the link number followed by the link it represents. You can also click on the link to go to the page that the link directed your audience to.
For example, if you clicked on one of the bars and it is labeled “Link 1” the grid will show the statistics for “Link 1” and just above the grid, you will see the word “Link 1” followed by your link’s URL.